Hello,大家好。上次我们介绍了,如何利用heatmap.js来画网页热力图,今天我们要介绍一下热力图的另一种展示形式 - 热力占比图。
可能大家还不太理解热力占比图是什么,我把两种效果都列出来,给大家对比看一下;想看实际效果的同学可以来看看我们的Demo效果,Webfunny前端埋点系统DEMO
1. 网页热力图,通过heatmap.js库把热力值画出来的效果,看起来比较直观。
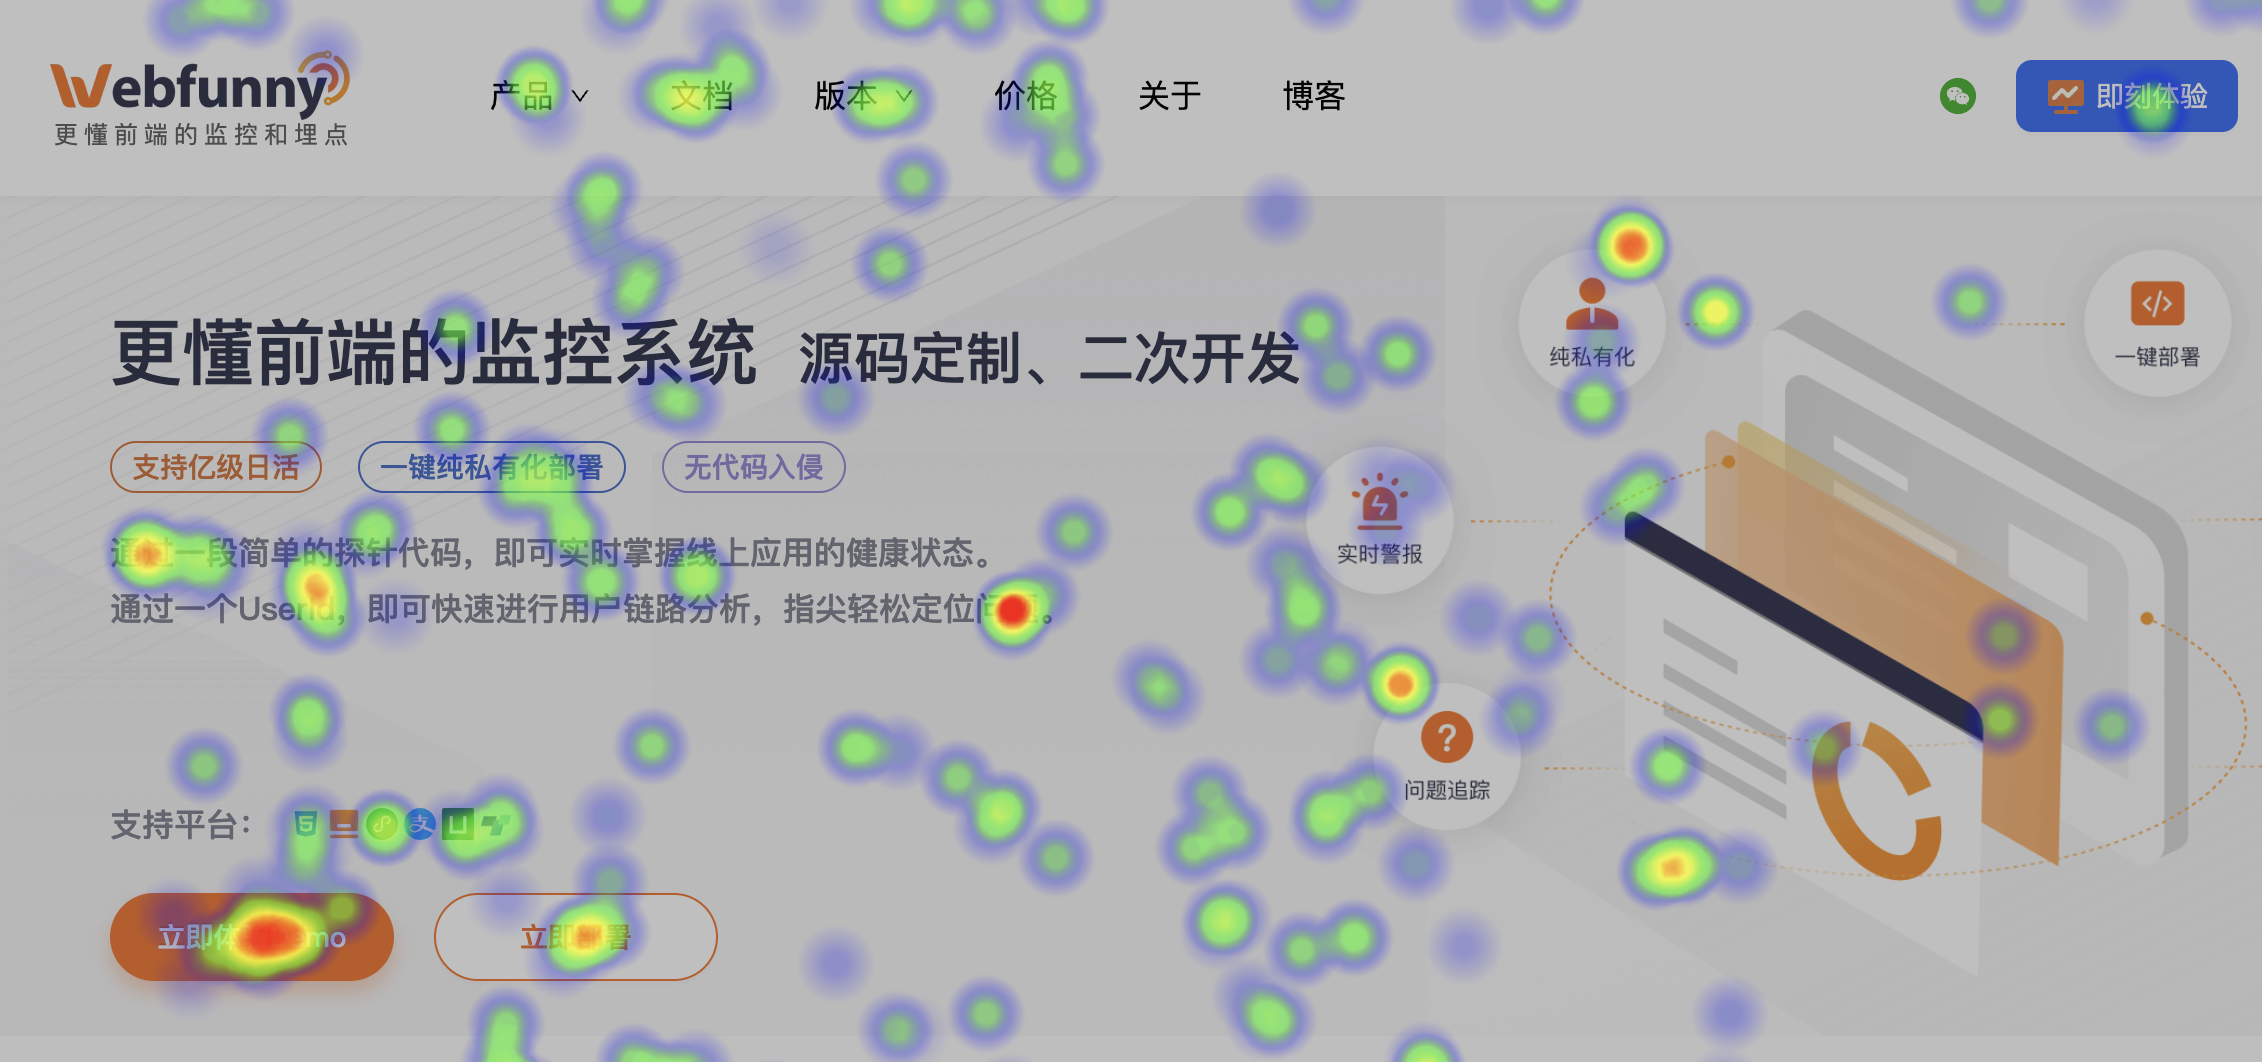
2. 热力占比图,把用户点击的元素位置和具体人数以百分比的形式展示出来,看起来比较具体。

接下来我就来讲讲如何实现这个效果。
一、采集网页热力数据
采集热力数据的方式跟上边热力图的方式是一样的,通过鼠标点击位置(x坐标,y坐标),来锁定页面坐标,计算热力值;采集代码如下:
/**
 * 启动点击事件监听
 */
export function startClickRecord() {
  window.addEventListener('click',function(e){
    console.log('触发点击事件!', e)
    if (!e) return

    /** 检查定时器是否开启 */
    if (store.timerStatus === 'off') {
      console.log('定时器已结束,触发鼠标点击,则重新开启')
      store.timerStatus = 'on';
      startGlobalTimer()
    }

    try {
      const scrollWidth = (document.body ? document.body.scrollWidth : 0) || window.innerWidth
      const weTitle = document.title
      const wePath = Utils.b64Code(Utils.getPath())
      const weFullPath = Utils.b64Code(Utils.getPath('full'))
      const weScrollWidth = scrollWidth - scrollWidth % 20
      const weScrollHeigh = (document.body ? document.body.scrollHeight : 0) || window.innerHeight
      const weXPath = Utils.getXPath(e)
      const wePageX = e.pageX
      const wePageY = e.pageY
      // const weScrollX = window.scrollX
      // const weScrollY = window.scrollY
      const weRatio = parseInt(window.devicePixelRatio)

      // 上报点击数据
      const data = {weTitle, wePath, weScrollWidth, weScrollHeigh, weXPath, weFullPath, wePageX, wePageY, weRatio}
      webfunnyGlobal.webfunnyEvent('Webfunny-Replace-HeatMapClickPointId').trackEvent(data);
    } catch(e) {
      console.error('click error', e)
    }

  }, true);
}
二、获取网页热力值,并生成tip浮框
获取热力值后,在页面上查找对应元素,并在该元素上生成一个小小的浮框,展示点击百分比。当你把鼠标移动到浮框上时,也会展示该热力值的详细数据,包括点击次数,点击人数,点击比例以及总次数和总人数等;
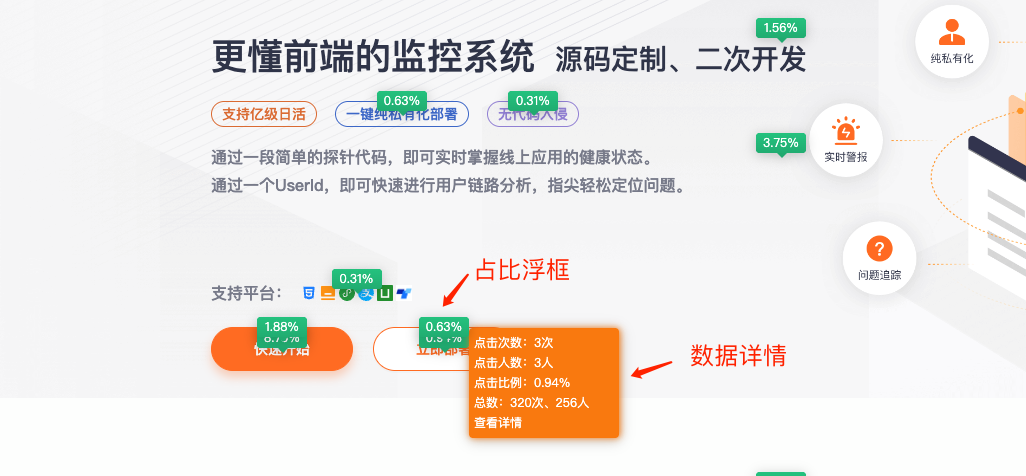
创建代码如下:
const createHeatDataTip = (param) => {
  const {xPath, percentage, count, userCount, totalCount, totalUserCount, webfunnyStartTime, webfunnyEndTime} = param
  let color1 = ''
  let color2 = ''
  if (percentage >= 50) {
    color1 = '#FFA166'
    color2 = '#FF8639'
  } else if (percentage >= 10) {
    color1 = '#7A79FF'
    color2 = '#6D6CE5'
  } else if (percentage >= 0) {
    color1 = '#28C989'
    color2 = '#24B27A'
  }
  const bgColor = ` background: linear-gradient(180deg, ${color1} 0%, ${color2} 116.67%); filter: drop-shadow(0px 2px 6px rgba(0, 0, 0, 0.20));`
  // 创建浮框元素
  const tooltip = document.createElement('div');
  const ele = getEleByXpath(xPath)
  if (!(ele && ele !== null)) {
    return
  }
  const { x, y, width } = ele.getBoundingClientRect()
  const letValue = x + width / 2 - 25
  const topValue = y - 10
  tooltip.className = 'webfunny-tip';
  tooltip.style = `top: ${topValue}px; left: ${letValue}px; ${bgColor}`;
  tooltip.textContent = percentage + '%'

  // 下三角
  const triangle = document.createElement('div');
  triangle.className = 'webfunny-triangle';
  triangle.style = ` border-top: 5px solid ${color2}; `;
  tooltip.appendChild(triangle)

  const tempXpath = utils.b64Code(xPath)
  const clickPointId = utils.getWfCookie("wf_click_pointId")
  const jumpUrl = `//${utils.getWfCookie("wf_fe_domain")}/wf_event/eventSearch.html?projectId=${PROJECT_ID}&pointId=${clickPointId}&xPath=${tempXpath}&startDate=${webfunnyStartTime}&endDate=${webfunnyEndTime}`

  // 详细信息
  const info = document.createElement('div');
  info.className = 'webfunny-info';
  info.innerHTML = `
  <label>点击次数:${count}次</label><br>
  <label>点击人数:${userCount}人</label><br>
  <label>点击比例:${percentage}%</label><br>
  <label>总数:${totalCount}次、${totalUserCount}人</label><br>
  <label><a target="_blank" href="${jumpUrl}" style="color: #fff;">查看详情</a></label>
  `
  tooltip.appendChild(info)

  document.body.appendChild(tooltip);
}
三、查看热力数据详情
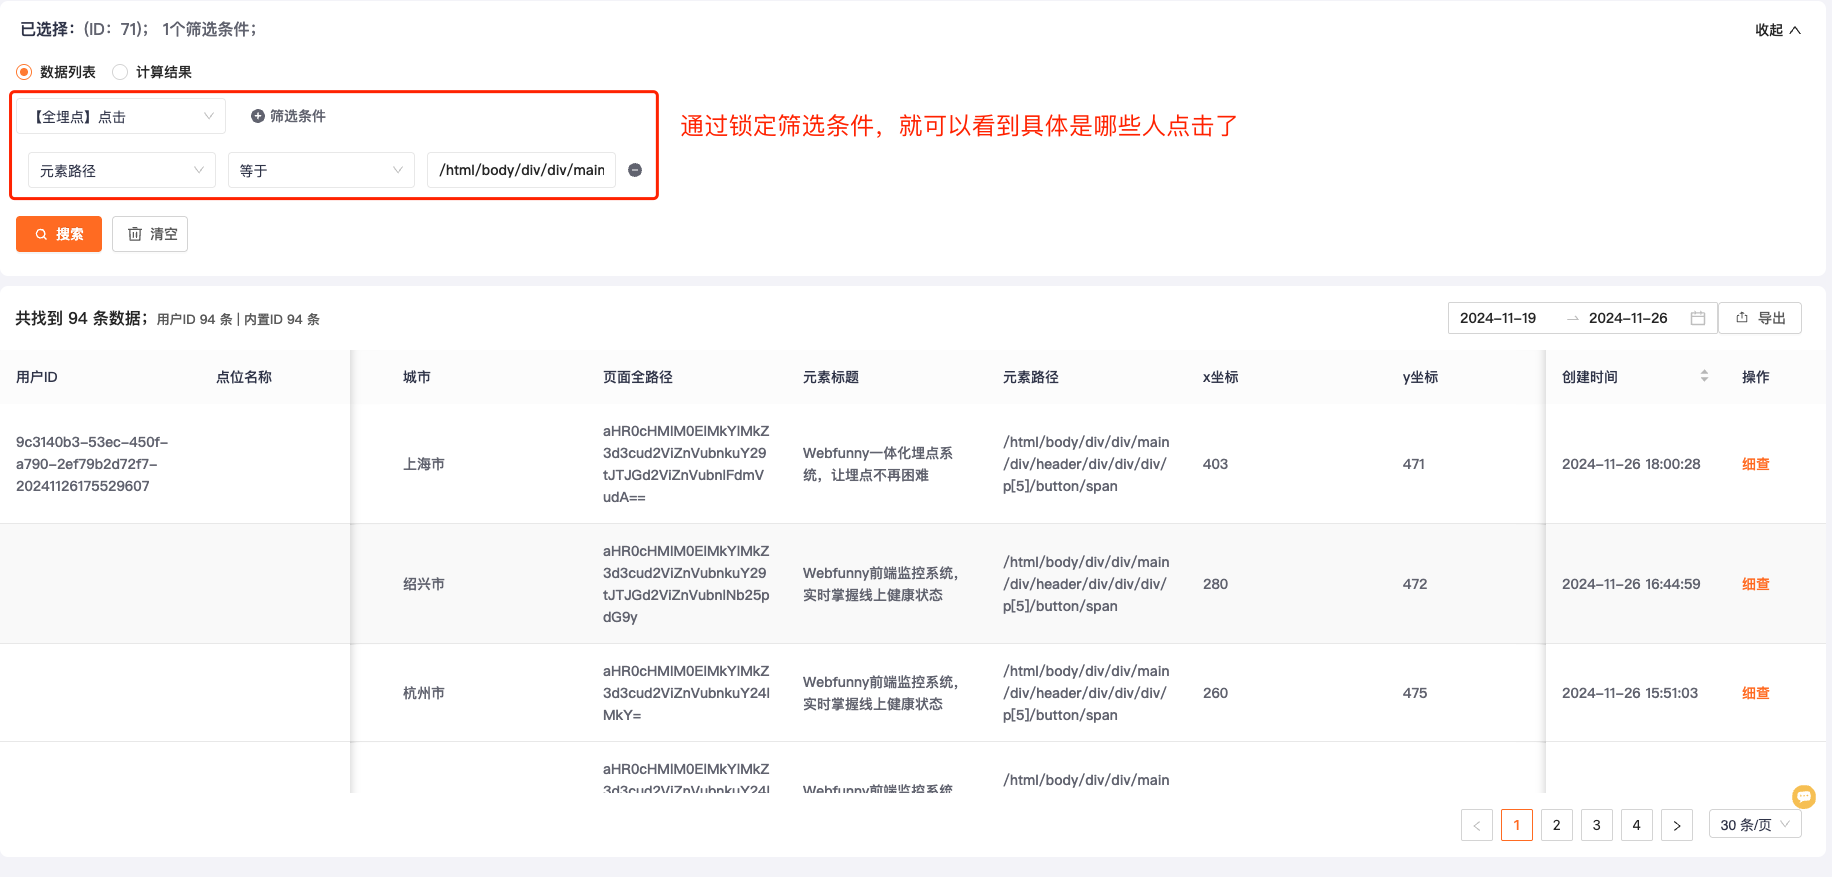
对于分析师而言,除了观察热力占比结果,很多时候还需要查看详情数据。比如:有100个人点击了购买按钮,具体是哪100个人?需不需要继续跟进呢等等,有了这些诉求,我们就必须有个可以查询的地方。、
通过锁定筛选条件,就可以准确的找到所有点击过这个按钮的人,进行进一步的处理。
总结
热力占比图同样也是埋点热力图的一种重要呈现形式,它的数据更加具体,同时也可以查找到对应每条记录,可以帮助业务做更深入的分析。

